Building a National Database on Fatal and Non-Fatal Police Shootings in the US, 2015
Yuchen Hou, Criminal Justice
NML Award: The Social Justice Award (April 2019)
Project Description
No single existing database can allow researchers to determine how often and under what circumstances civilians have died from or survived police shootings in the US. To help fill the gap, Yuchen Hou’s dissertation research uses open sources to build a crowdsourced national database on fatal and non-fatal police shootings (FNFPS) in the US in 2015.![]()
Identifying as completely as possible the counts and the attributes of FNFPS will follow a three-step approach: (1) The universe of FNFPS occurring in 2015 will be extracted from the Gun Violence Archive database. (2) Additional open source documents for validating incidents will be located using the Google search engine searching for incident information. (3) A coding team of 7 undergraduates from John Jay College will code and examine relevant attributes of FNFPS based on at least three different open source materials.
This database that captures incident-, context-, and agency-related information allows us to understand how selected features of situations, contexts, and police agencies interact with key parts of police shootings: officers, civilians, and places. Once the database is completed, this digital research will support multilevel analyses to estimate factors at individual, situational, contextual, and organizational levels that may contribute differently between fatal and non-fatal police shootings.
To make findings available to broader audiences, this research aims to create a CUNY Academic Commons website that displays a series of interactive maps visualizing the geographical distribution of FNFPS at national, regional, state, and city levels, and presents results from quantitative analyses. The web-embedded interactive maps will be generated using CARTO or Tableau online software, which are free of charge for students. In consultation with web developers, Hou will embed a searchable database on the website.
This website will not only allow for information audit and exchange to improve data accuracy, but it will also provide communities and social organizations with opportunities for external review of police legitimacy.
This research is one of the first attempts to apply emerging open source research methods to study police-citizen encounters which are most commonly measured by self-reports and official records. The creation of this crowdsourced database can help us understand how selected features of situations, contexts, and police agencies interact with key parts of police shootings: officers, civilians, and places. This open data collection effort allows us to provide a guideline for federal and local police agencies to follow in devising data reporting and collection systems on police use of deadly force. Findings will help police organizations, communities, and other stakeholders rethink this problem and collaboratively develop evidence-based policing reforms on policies and practices.
Work Completed to Date
In September 2018, Hou, in collaboration with one of his dissertation committee members, formed a faulty-student research team to build the CND on FNFPS. Hou has recruited and trained 7 students from John Jay College to use the SPSS statistical program to code incident-level data. Data collection was initiated in late September 2018. Currently, the research team has completed the incident-level data coding of police shootings that occurred from January to May 2015.
preliminary descriptive results of January cases
The following results had been presented at the American Society of Criminology Annual Meeting. The results of descriptive analyses of January cases show that frequencies of FNFPS vary across states, racial/ethnic groups, and levels of threat posed by encountered civilians.
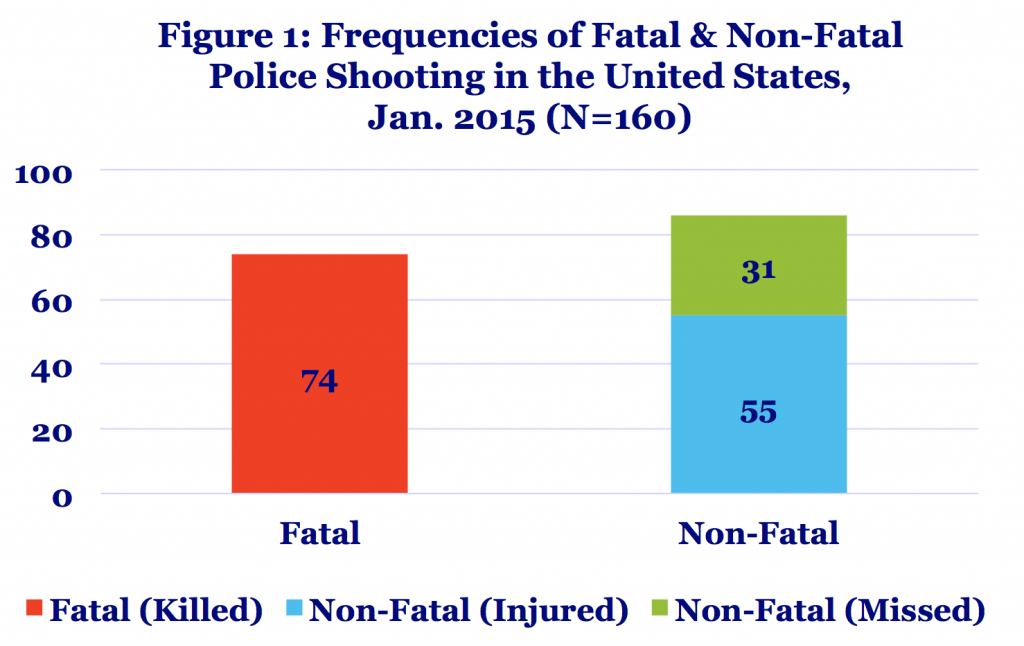
- As shown in Figure 1, the research team coded 160 police shootings that occurred in January 2015. Among them, 74 are fatal cases where at least one civilian was shot and killed by police. Of 86 non-fatal police shootings, 55 cases involved civilian being shot and injured due to officers’ discharge of firearm. 31 cases involved civilians not being struck by bullets fired by police.
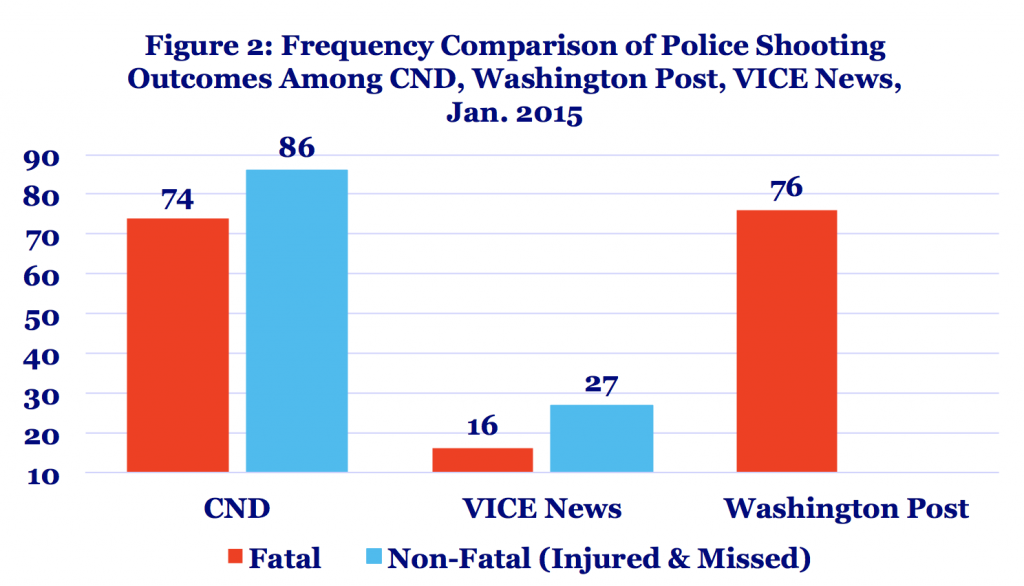
- Figure 2 displays a frequency comparison of police shootings captured by our CND, VICE News, and Washington Post. Most of the fatal police shootings coded in our dataset are matched with those captured by Washington Post. In VICE News shot by police dataset, 16 January cases included are fatal. Since that VICE News only capture fatal and non-fatal police shootings involved 47 largest local police departments, we may assume that what our database captures may involve more cases that occurred in cities with medium and small population. This figure also illustrates the nature of deadly force that “does not always kill” (Fyfe, 1988). Eighty six police shootings coded in our dataset resulted in non-fatal outcomes. Factors that may differentially contribute to fatal versus non-fatal outcomes warrant more research attention.
- Figure 3 shows the frequency distribution of police shootings that occurred in Jan 2015, across 50 states and 1 Federal District, in descending order. Red, blue, and green colors within each bar show the breakdown of killed, injured, and missed shooting outcomes. Due to the small sample sizes for many states, this analysis does not standardize the frequencies by population. As shown in this figure, there is wide variation in the frequencies of police shootings across states. Alaska, Hawaii, North Dakota, Vermont, Wisconsin, Wyoming did not involve police shootings over the time period studies. But police agencies in 8 states are responsible for 50% of police shootings occurring in January, 2015. Police shootings occurred mostly frequently in Texas, California, Florida, Colorado, Missouri, Arizona, New Mexico, and New York in Jan 2015. You may observe that some states are more likely to be involved in fatal police shootings. Such as Texas, Arizona. We should ask whether mechanisms likely to provoke fatal police shootings are also contextualized in different social settings.

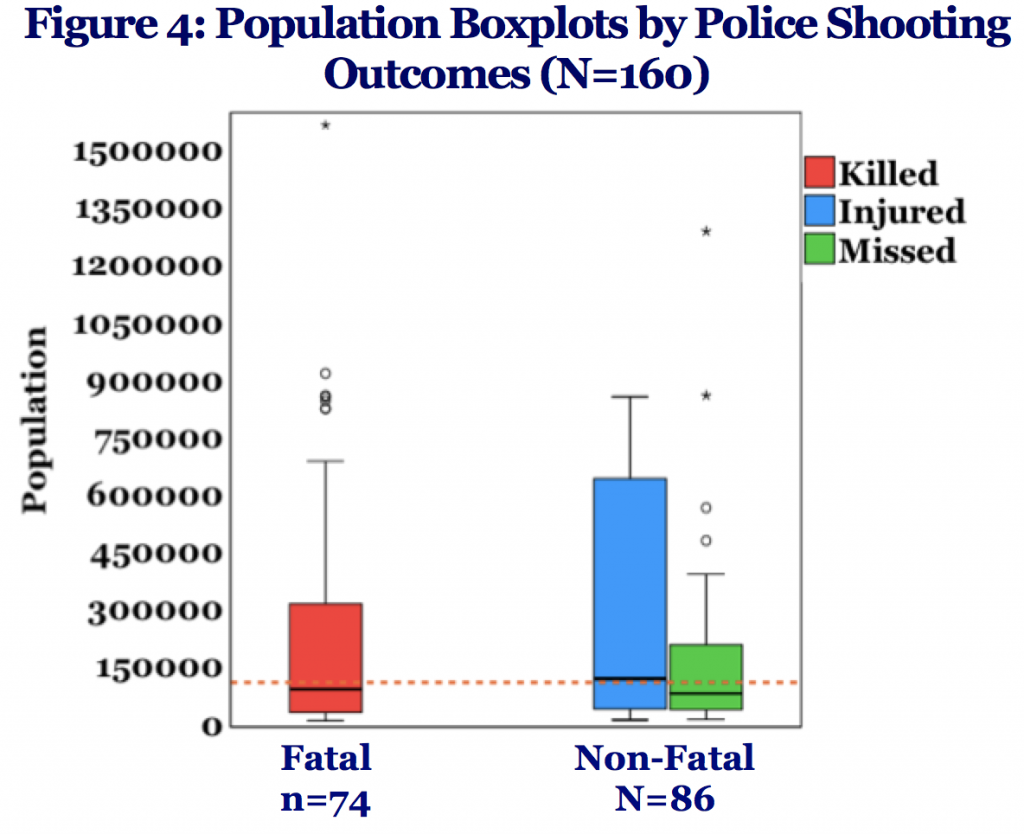
- Cities with population more than 100,000 are viewed as large cities. In Figure 4, the population boxplots by three police shooting outcomes are positively skewed, showing that cities with population less than 100, 000 were responsible for more than 50% police shootings, both fatal and non-fatal, that occurred in Jan 2015. Differences among the Interquartile ranges show that the distribution of population of which cities were responsible for police shootings with injured outcomes are more variable than the ones for police shootings with fatal outcomes and missed outcomes. This preliminary result is consistent with Sherman’s finding that agencies serving cities with fewer than 50,000 were responsible for 50% of fatal police shootings (2015).
-
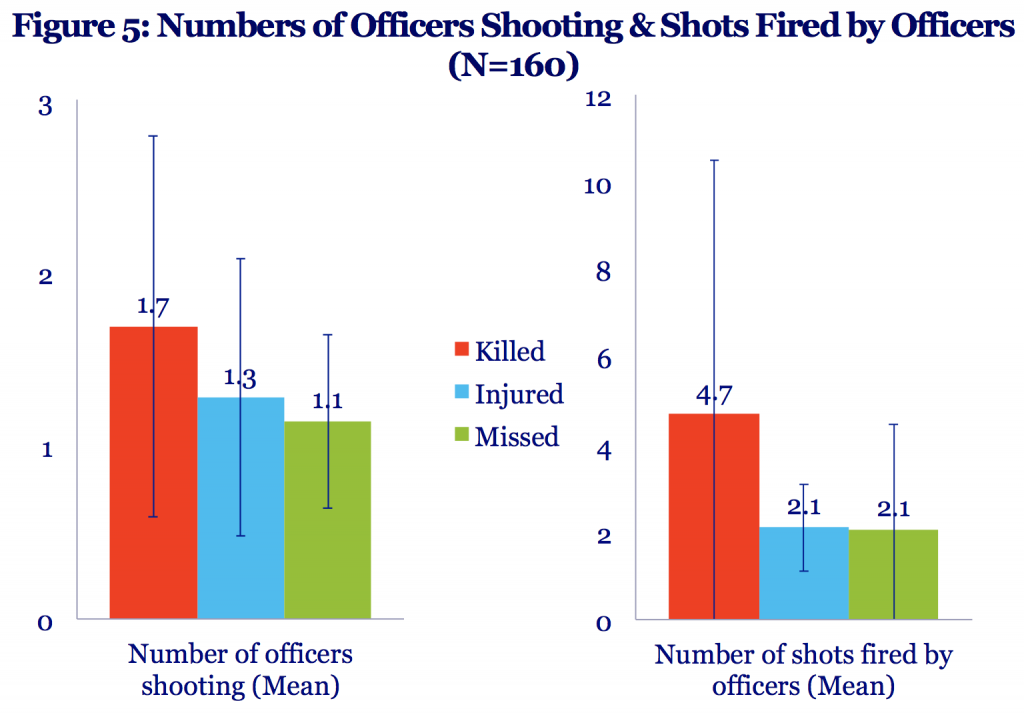
As indicated in Figure 5, the average number of officers shooting on a fatal police shooting incident is slightly higher than those of non-fatal police shootings. The average number of shots fired by officers for fatal police shootings is 4.7, more than twice as many shots as the average number for non-fatal police shootings. Multiple officers shooting and multiple shots fired may be directly associated with fatality of police shootings.
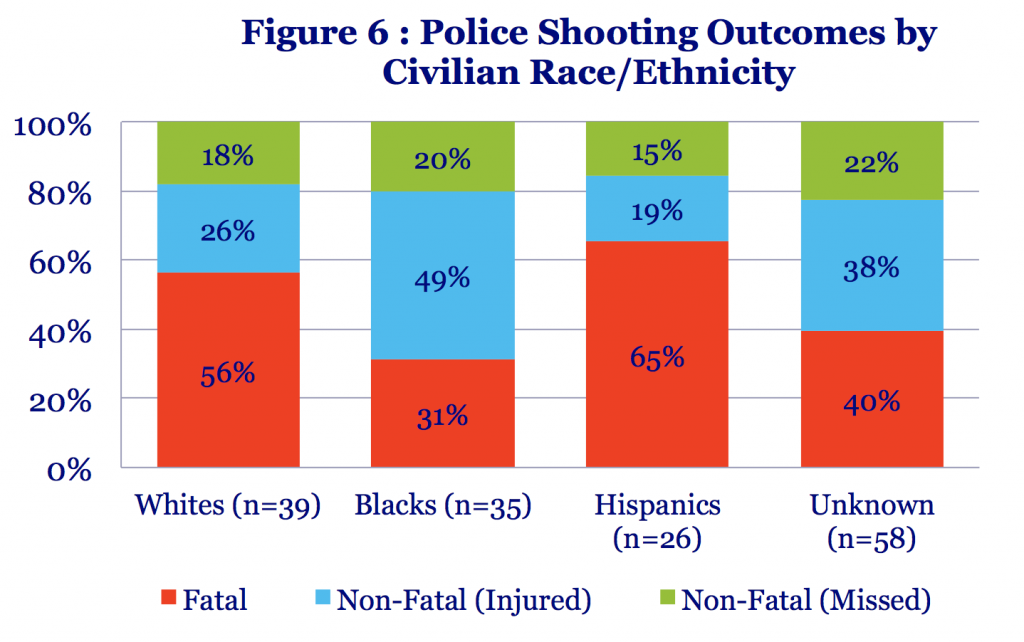
- Considerable racial disparities in police shooting outcomes exist in January cases. 31% of Blacks, 65% of Hispanics and 56% of Whites were shot and killed by police as shown in Figure 6. This result can be linked to where fatal police shootings occurred most frequently, such as Texas, California, and Arizona. There are also missingnesspatterns of reporting civilians’ demographic information in open sources. Encountered civilian’s race was less likely to be reported for non-fatal police shootings. It makes sense that fatal police shootings are more newsworthy or noteworthy.
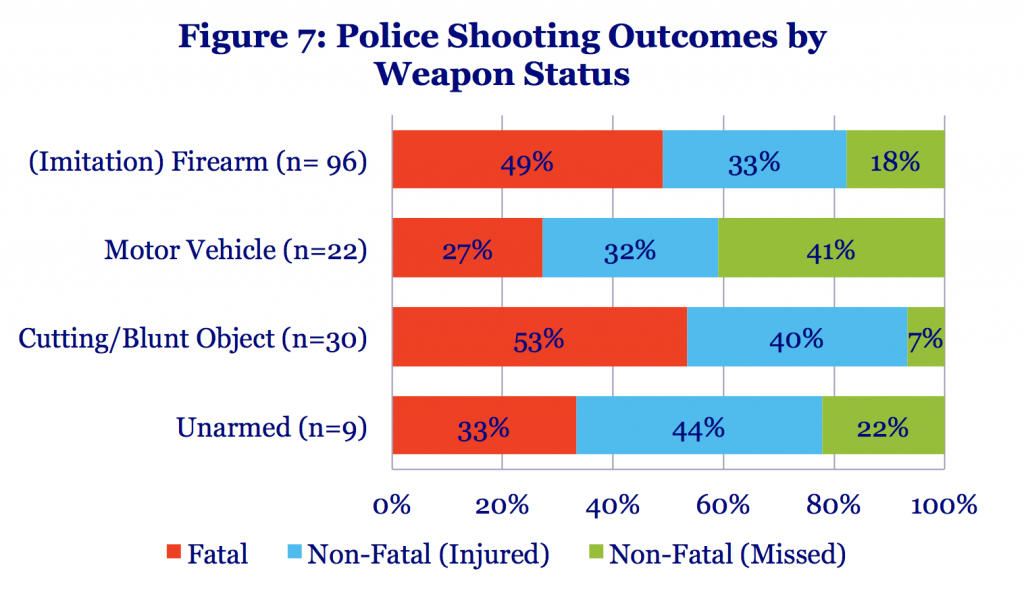
- As shown in Figure 7, the majority of civilians shot by officers were in possession of firearms or imitation firearms. Among them, near 50% were killed. 53% of Civilians who armed with cutting or blunt objects were shot and killed. 73% of civilians who used vehicle as weapon to attack were shot but not killed. These differences in police shooting outcomes by weapon status illustrate that more dynamic encounters may result in non-fatal police shootings.
Limitations
